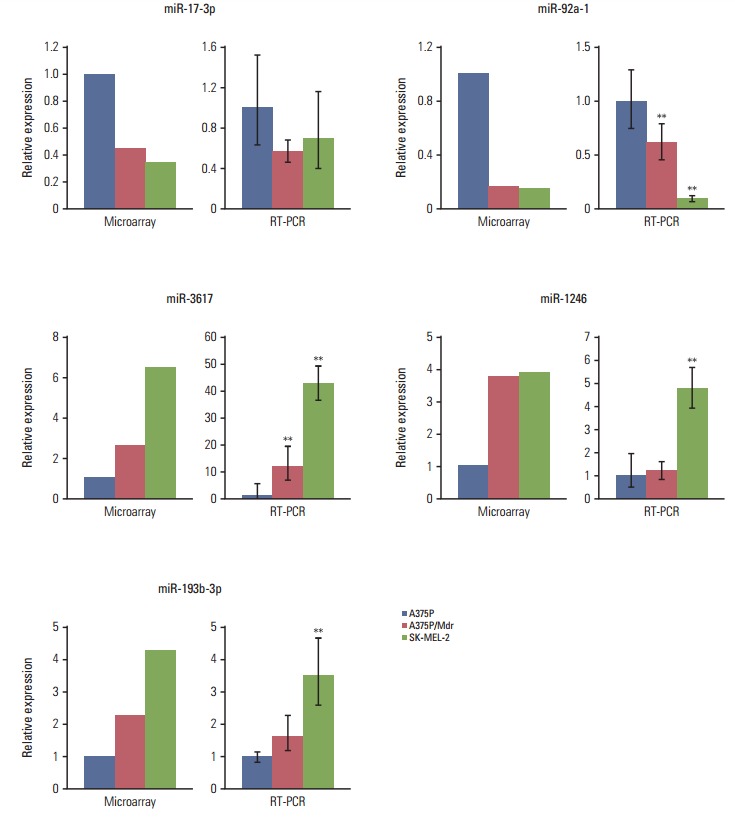
Fig. 1.

Validation of miRNA microarray data using miRNA-specific real-time quantitative reverse-transcription polymerase chain reaction. Real-time reverse-transcription polymerase chain reaction was conducted to measure the mRNA expression levels of miR-17-3-p, miR-92a-1, miR-3617, miR-1246, and miR-193b-3p. The mean threshold cycle (Ct) was determined based on triplicate reactions. The 2−ΔΔCt method was used to calculate the fold differences in miRNA expression among the tested samples. The expression of the target genes was normalized to GAPDH expression. **p < 0.01 according to Dunnett’s t test in relative to BRAF inhibitor–sensitive A375P cells.
