Fig. 4.

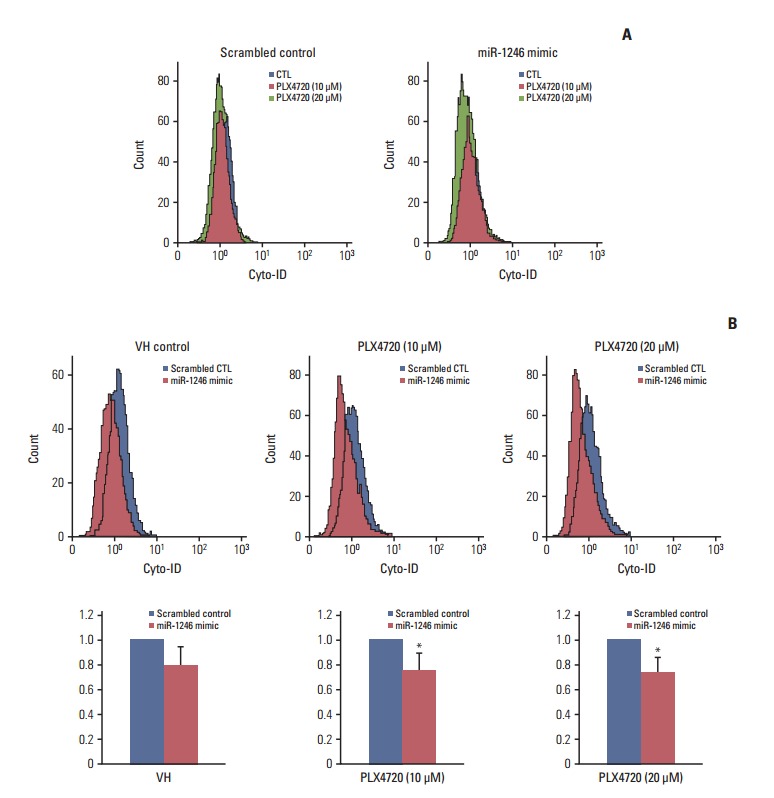
Impaired autophagic flux during PLX4720-induced growth inhibition of A375P/Mdr cells. After transient transfection with a miR-1246 mimic or control RNA for 24 hours, autophagic flux was monitored in cells exposed to 20 μM PLX4720 for 48 hours. Autophagy was then detected by flow cytometric analysis of cells incubated with Cyto-ID green fluorescent probes, which detect autophagic vacuoles. (A) A representative histogram of the flow cytometric analysis is shown. Data are representative of at least two independent experiments. (B) The values are expressed as a fold increase, where the value observed in control RNA–transfected cells was set to 1.0. The upper panel shows a representative histogram of flow cytometric analysis. The lower panel shows the summarized data describing the percentage of cells positive for Cyto-ID fluorescence (n=3). CTL, control. *p < 0.05 compared with the vehicle control, as determined by Dunnett’s t test
