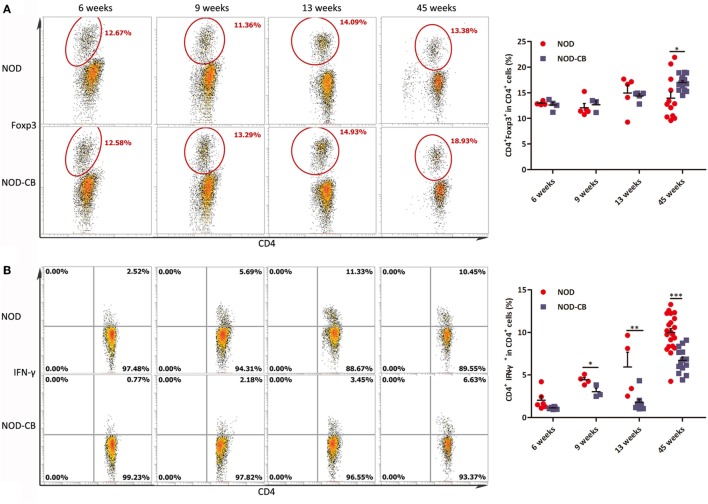
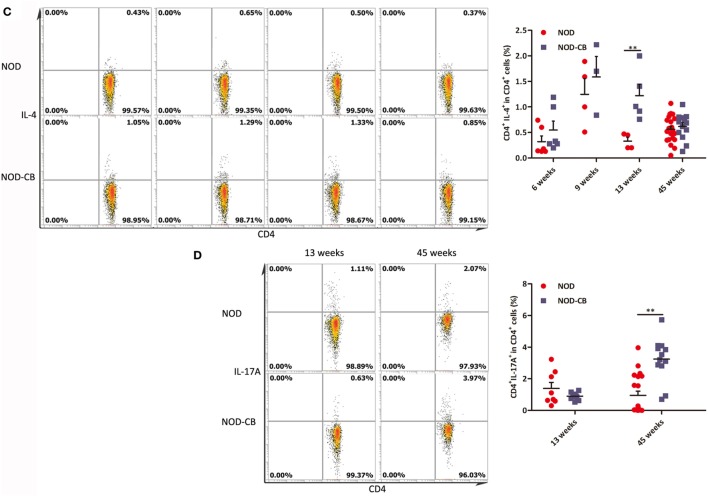
Figure 9.
CB0313.1 changes the splenic cytokine profiles. (A) Percent CD4+Foxp3+ cells in spleen as indicated at 6, 9, 13, and 45 weeks of age. Percent CD4+IFN-γ+ (B) CD4+IL-4+ (C) and CD4+IL-17A+ (D) cells in spleen as indicated. Data are mean ± SEM (n = 3–21 mice per group). *, **, *** p < 0.05, p < 0.01, p < 0.001 vs NOD control mice by t-test. The number of cells is 10,000.


