
Figure 3.
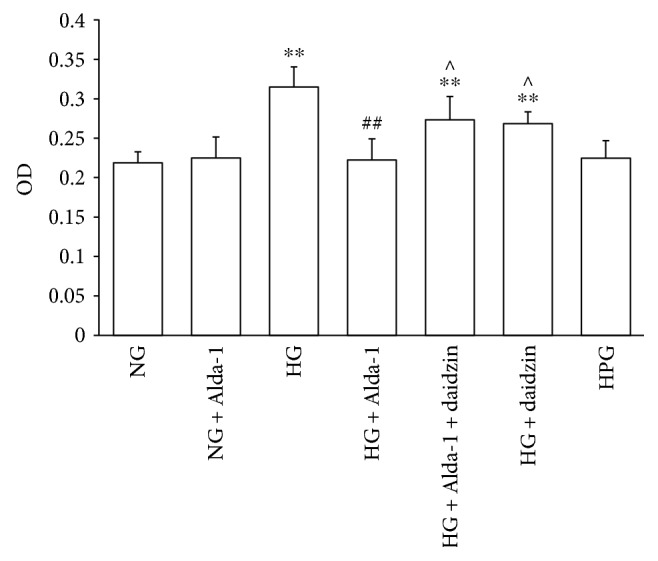
The OD value of CFs in different experimental groups were measured by MTT method. Data were presented as the mean ± SEM (N = 6). ∗∗P < 0.01 versus NG, ##P < 0.01 versus HG, ^P < 0.05 versus HG + Alda-1.
Official websites use .gov
A
.gov website belongs to an official
government organization in the United States.
Secure .gov websites use HTTPS
A lock (
) or https:// means you've safely
connected to the .gov website. Share sensitive
information only on official, secure websites.
The OD value of CFs in different experimental groups were measured by MTT method. Data were presented as the mean ± SEM (N = 6). ∗∗P < 0.01 versus NG, ##P < 0.01 versus HG, ^P < 0.05 versus HG + Alda-1.