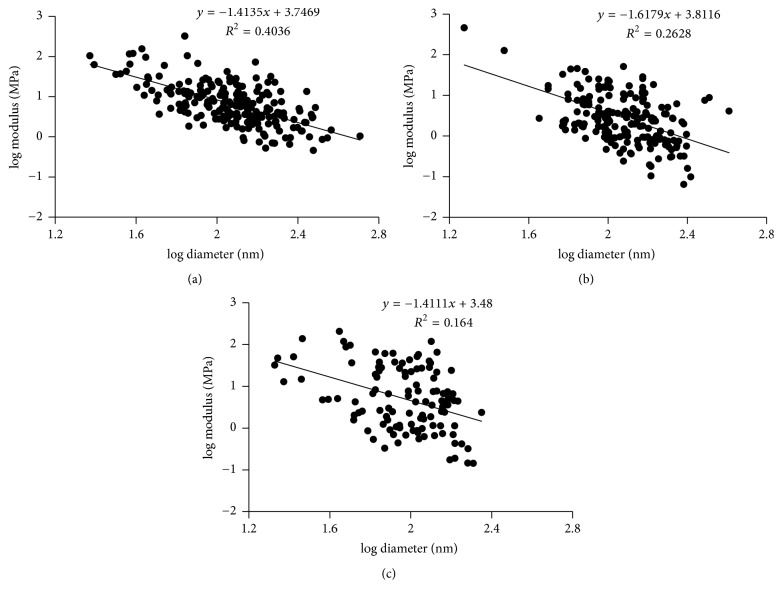
Figure 5.
Fibrin fiber modulus as a function of diameter. (a) For plasma samples from white males, the slope was −1.4 ± 0.1 on a log-log scale. (b) For plasma samples from black females, the slope was −1.6 ± 0.2. (c) For samples from purified fibrinogen, the slope was −1.4 ± 0.3. Figures 5(b) and 5(c) are adopted from [18].

