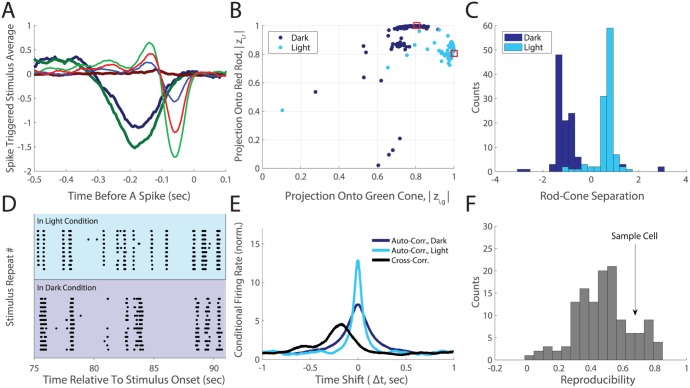
Fig 1. Changes in individual RGC feature selectivities are consistent with a switch between rod and cone dominated circuitry.
A. Color-dependent STA for a sample ganglion cell (Experiment #1). Lighter shades measured in the light condition. Red, green and blue colors correspond to the monitor gun. B. Projections of the ganglion cell color profiles onto the red rod (zi,r) on the y-axis plotted versus the projection onto the green cone (zi,g) for N = 111 ganglion cells (see Supplement); dark blue dots for the dark, light blue dots for light condition. Absolute values are used to provide invariance to the sign of the color vector (ON- vs. OFF-type cells). The rod-cone overlap (similarity of the two photopigments) is plotted as red squares. C. The distribution of the rod-cone spectral separations (see Supplement), plotted for the dark (dark blue) and light (light blue) conditions. D. Responses of a sample ganglion cell to repeated presentations of the same stimulus segment, in the two conditions. E. Auto- and cross-correlations of spike trains for the cell in panel D, calculated excluding spikes from the same trial; dark-dark auto-correlation (dark blue), light-light auto-correlation (light blue), dark-light cross-correlation (black). These are normalized by the probability of a spike, so that this measure tends to 1 at long time shifts. F. Distribution over ganglion cells of the reproducibility (see main text) of spikes across light adapted conditions, with an arrow indicating the sample cell in D,E.

