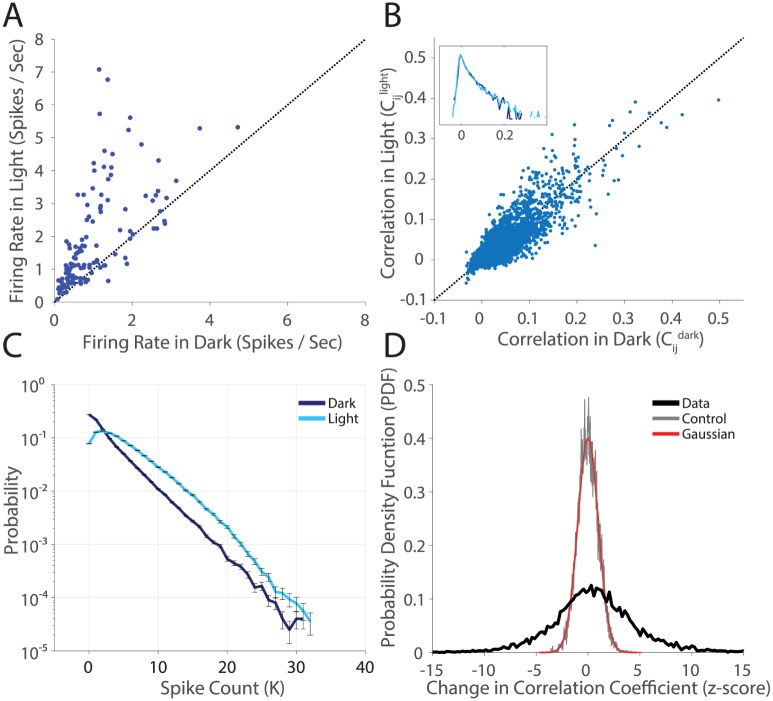
Fig 2. Statistically significant changes in population structure across stimulus conditions.
A. Firing rate in the light condition plotted against firing rate in the dark for all N = 128 cells. Error bars are given by the standard error of the mean (SE) and are smaller than the plotted points. B. Pairwise correlation in the light plotted against pairwise correlation in the dark, for all 128 ⋅ 127/2 pairs of cells. Error Bars are not shown (but see panel D). Inset is the probability density function (PDF), on a log scale, of correlation coefficients. C. Measured P(K) in the two light conditions. K is the number of active cells in a state. Error bars are given by the SE. D. The PDF of z-scores of changes in correlation coefficients. The change in correlation coefficient is normalized by the error (). These error bars are standard deviations over bootstrap resamples of the data, estimated per cell pair. Data compares the light and dark adapted conditions (thick black line), the control compares a random half of the dark dataset to the other half (gray), and a numerical gaussian is plotted in red for comparison.

