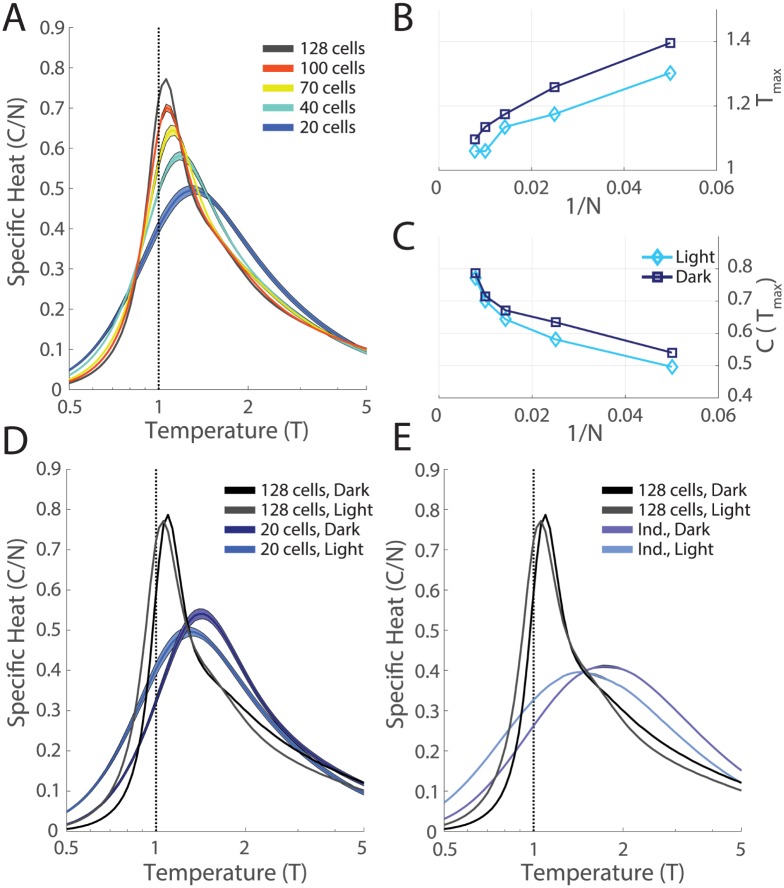
Fig 3. Phase transitions robustly present in both stimulus conditions.
A. For each value of N, we selected 10 groups of cells (out of the N = 128, M1, light recording). For each group we inferred the k-pairwise maximum entropy model as in [19], and estimated the specific heat. Shaded areas are the SE. B,C. Peak temperature, Tmax, and peak specific heat, C(Tmax), plotted as a function of inverse system size, 1/N. D. Specific heat plotted versus temperature for the full network (N = 128) and for smaller subnetworks (N = 20) for both the dark and light conditions. Error bars as in A. E. Comparison of the specific heat of the full network to that of an independent network estimated from shuffled data, for both the dark and light conditions.

