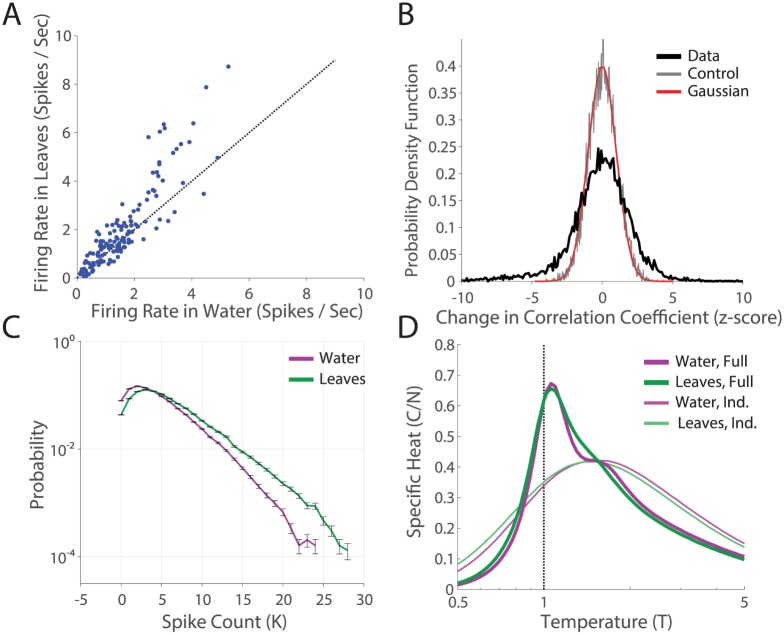
Fig 4. Robustness of phase transition to alternate adaptive mechanisms.
A. Firing rate in the “leaves” natural movie (M1) plotted against firing rate in the “water” natural movie (M2) condition, for all N = 140 cells. Error bars are the SE. B. The distribution of changes in correlation coefficient across the two stimulus conditions, for all 140 ⋅ 139/2 pairs of cells. C. Distributions of the spike count, P(K), across the two stimulus conditions. D. Specific heats for full data and shuffled data (calculated as in Fig 3), in the two natural movie conditions.

