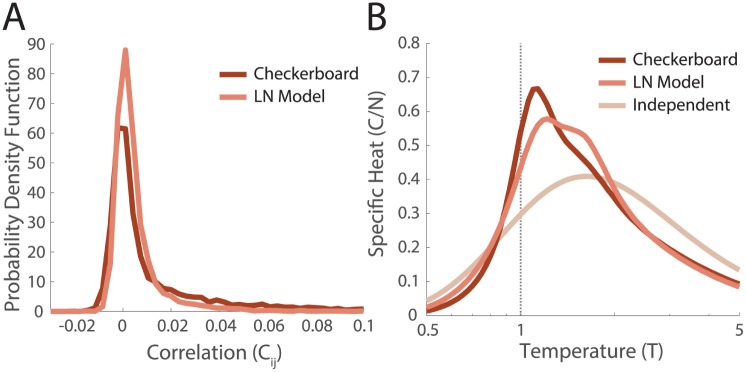
Fig 6. Networks of model LN neurons.
Model LN neurons were fit to the measured receptive fields as described in the text, N = 111 ganglion cells. A. Distributions of correlation coefficients over pairs of cells estimated in the training data (responding to checkerboard), and the simulated network of LN neurons. B. The specific heats in the checkerboard and simulated LN network. The independent curve is the same analytic estimate as in Fig 5.

