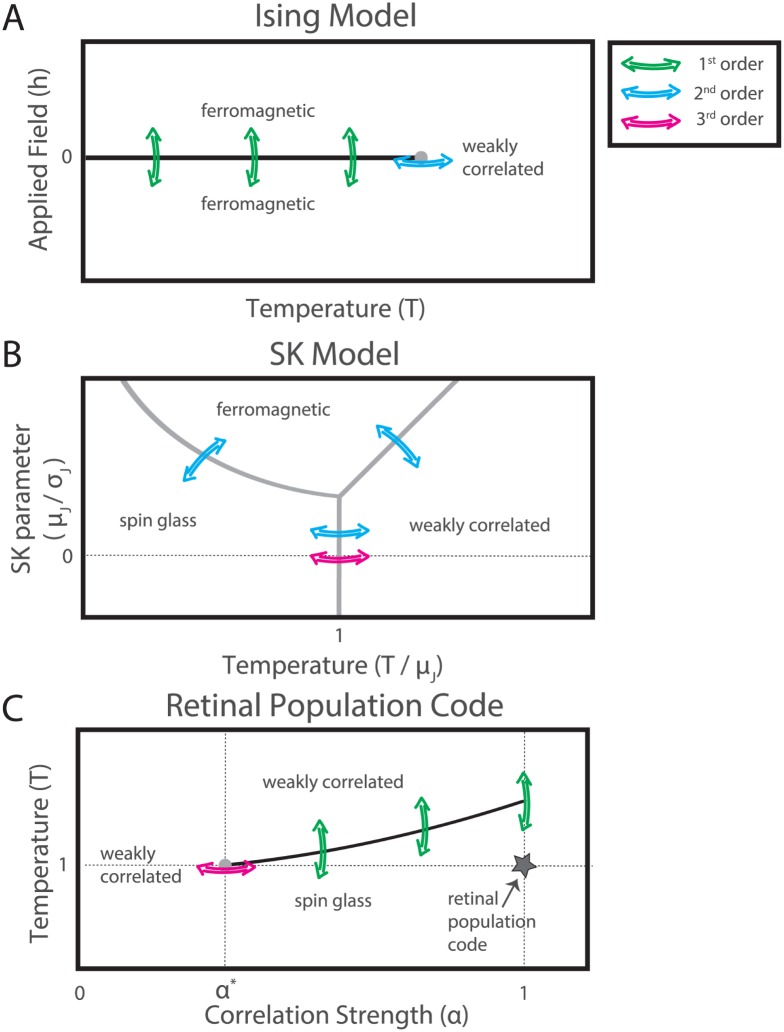
Fig 10. The phase space of the retinal population code.
Sketches of the phase space of the nearest neighbor Ising ferromagnet (A), the Sherrington-Kirkpatrick model (B, following Fig.1 in Ref. [67]), and our work (C). Black lines indicate boundaries between phases which correspond to first-order phase transitions, while gray dots and gray lines correspond to transitions of higher-order (second- or third-order, depending on the model). Colored arrows indicate phase transitions of different orders. A. The line of first-order phase transitions is centered on an applied field h = 0, the critical point here is second-order. B. All transitions here are second-order, except in the spin glass limit, where they are third-order (the spin glass limit, μJ ≪ σJ, is denoted by the dotted line). As explained later on in the text, the second-order transitions here are marked by a discontinuity, not divergence, in the specific heat. C. In our work, a third-order phase transition as a function of correlation (at α = α*, T = 0) is the origin of a line of first-order phase transitions as a function of temperature. The location of the real neural population code is denoted by a star.

