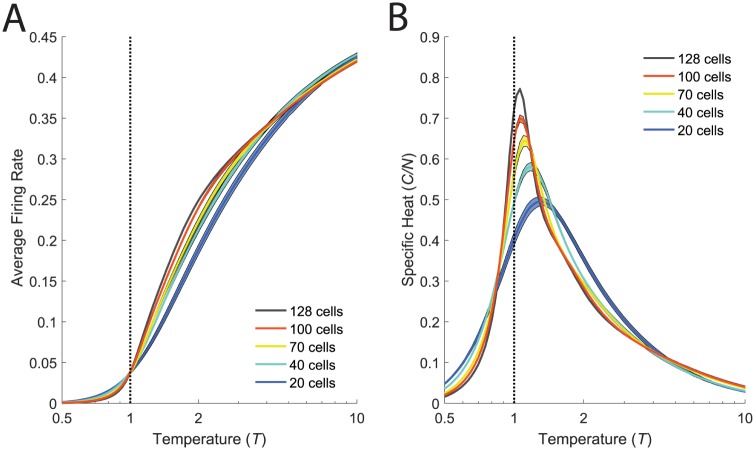
Fig 11. A sharp increase in firing rates accompanies the phase transition.
A. Firing rates averaged over cells plotted as a function of the temperature, T, during the same annealing procedure used to estimate the specific heat (B, reproduced from Fig 3 for convenience). Model parameters were inferred for the k-pairwise maximum entropy model, in the light condition. Error bars (shaded regions) are the standard error of the mean.

