Figure 5.
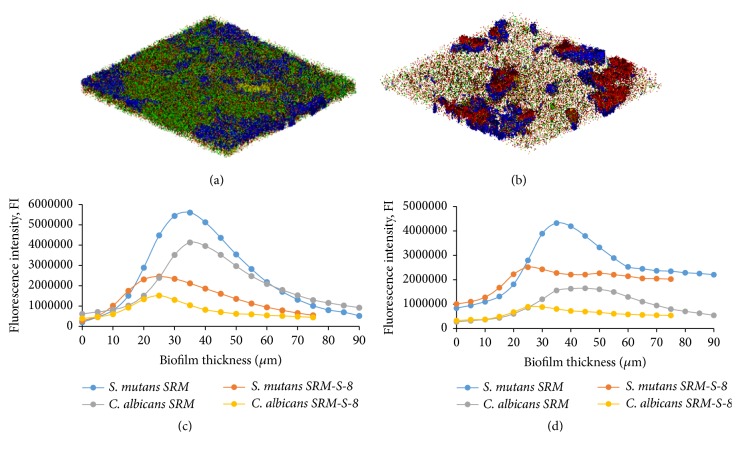
Microbial and EPS composition in mixed biofilms. CLSM merged images of biofilms of C. albicans and S. mutans microbial and EPS composition in control SRM coated HA (a) and treated SRM-S-8 coated HA tablets (b). Green color represents fungi and blue bacteria, yellow represents fungal EPS, and red represents bacteria. Magnification: 10x. At least three random fields were observed and analyzed, from three independent experiments. (c) Quantitative measurement of microbial composition. (d) Quantitative measurement of EPS production.

