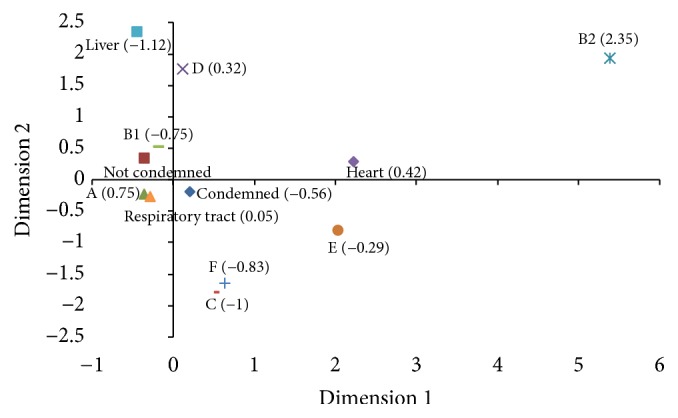
Figure 3.

Correspondence analysis for the categories. This two-dimensional representation explains 42.52% of the total variation with 15.59% explained by 1st dimension, 13.86% by the 2nd dimension, and 13.07% by the 3rd. The value of the third dimension is shown in parenthesis.
