
Figure 1.
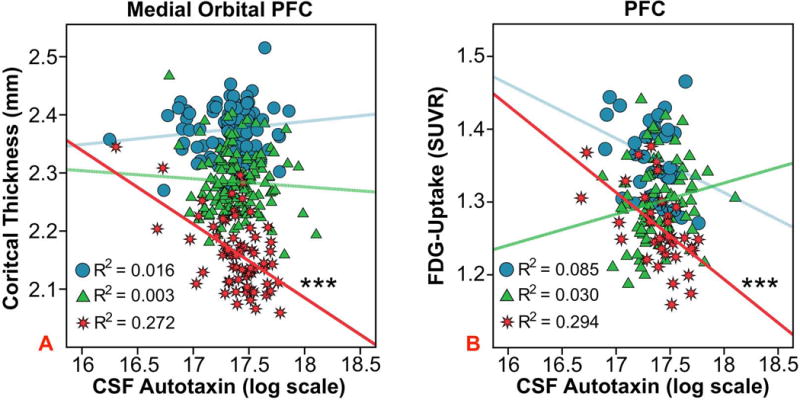
Autotaxin and PFC region of interest analyses. The association between CSF autotaxin and baseline bilateral medial orbital PFC cortical thickness (A) or bilateral PFC FDG-PET glucose uptake (B), an index of glucose metabolism, among baseline diagnosis groups. The “blue circle”, “green triangle”, and “red star” symbols correspond to CN, MCI, and AD participants respectively. The R2 value refers to the proportion of variance in CT or FDG-PET uptake explained by autotaxin for a given group. ***p < 0.001.