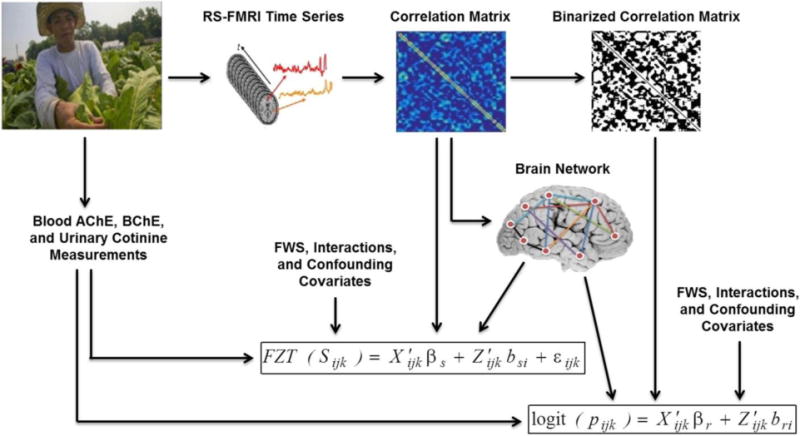
Figure 2.1. Schematic of different steps.

Rs-fMRI data were collected from each study participant. The average time series was determined from 116 anatomical brain regions as defined in the AAL atlas. Each region served as a network node. A correlation matrix was obtained through calculating the Pearson correlation between the average time series from every node pair, with negative correlation set to zero. The adjacency matrix was obtained via binarizing the correlation matrix. The four network metrics including nodal clustering coefficient, global efficiency, degree and overall modularity were extracted from the weighted brain network. These metrics along with exposure measurements including blood AChE and BChE activities, and urinary cotinine levels, farmworker status (FWS), and confounding variables were used as covariates in the two-part mixed-effects modeling framework to assess the relationship of farmworker status (and other covariates) with the probability and strength of functional brain connections. (2-column figure)
