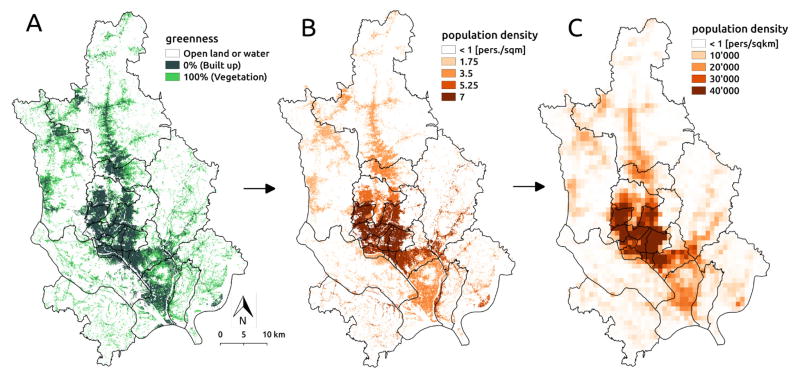
Figure 2.
Population aggregation methodology. (A) Built-up area map shown in terms of the percentage of each pixel covered by vegetation (”greenness” index). (B) Dasymetric mapping of thana-specific population density at 12m resolution. (C) Aggregated population density at 1km resolution used to compute mobility fluxes. Black lines represent thana administrative boundaries.

