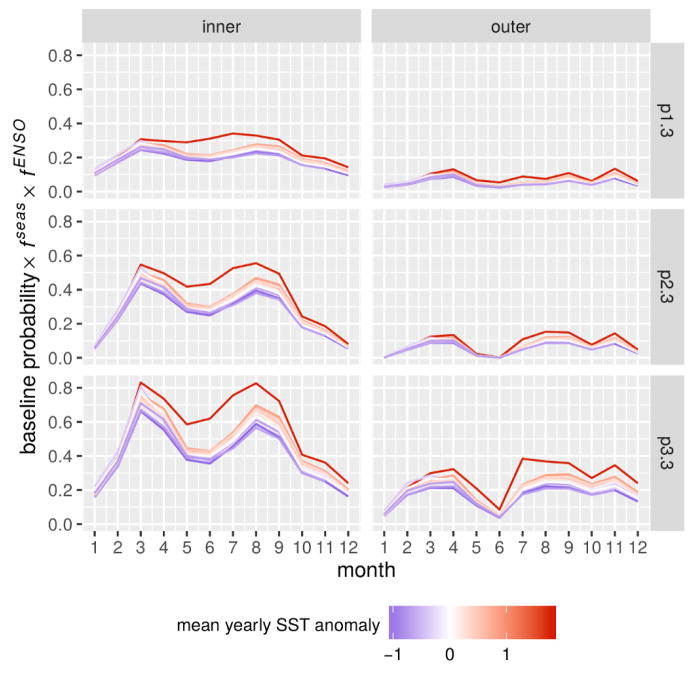
Figure 4.
Climate effect on the interannual variability of cholera risk. The probability of transitioning to a high cholera state from no (p1,3), low (p2,3) and high cholera (p3,3) is shown accounting for the effect of seasonality (fseas) and the ENSO (fENSO) by month, year, and thana group. The intensity of the ENSO is indicated by the mean value of the SST anomaly in each year from low (blue) to high (red).

