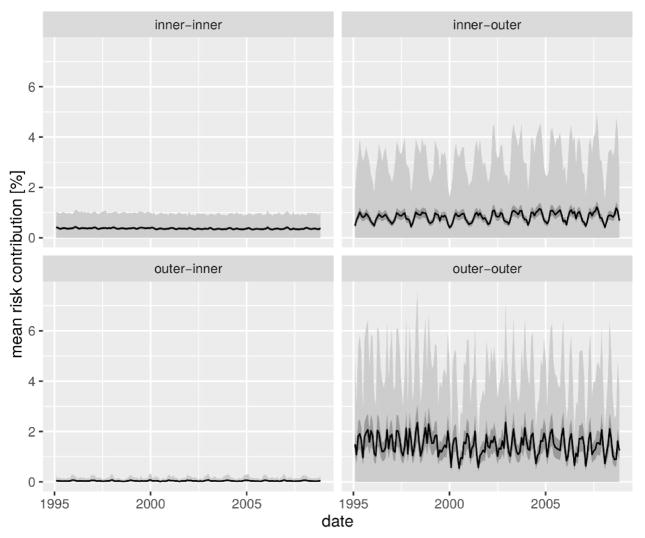
Figure 5.
Cholera risk spread in the city due to human mobility. The thana-to-thana contribution in cholera risk is illustrated in terms of the overall mean percentage increase in the baseline transition probability between the two regions of the city (black line) along with the 95% confidence intervals of the value of the mean (dark gray ribbon) over 1000 simulations of the state transitions. The variability of the difference over realizations is given in terms of the mean ± standard deviation (light gray difference).

