
Fig. 1.
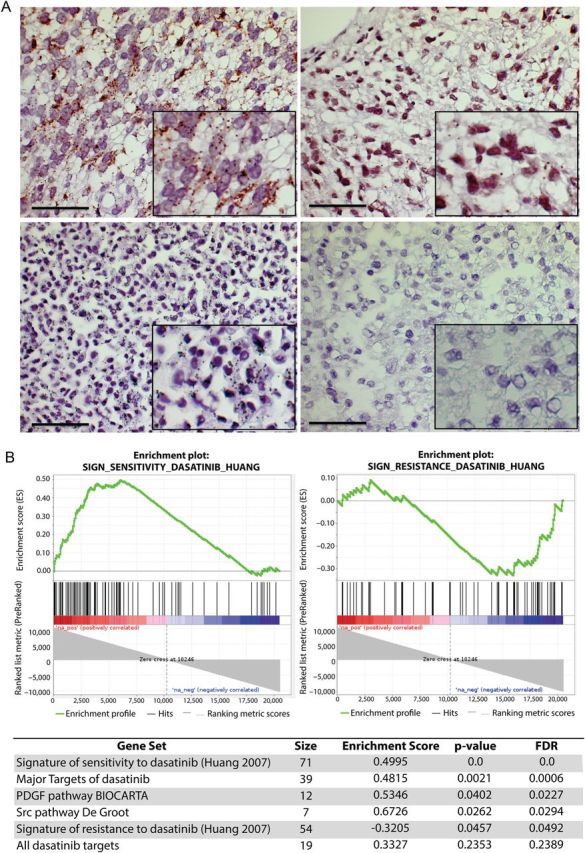
Frequent activation of PDGFRA and prediction of sensitivity to dasatinib in DIPG patients. (A) Phospho-PDGFRA proximity ligation assay. Upper panels represent tumors from DIPG patients (#4 and #11, described in the Supplementary Table S1). Lower panels represent positive and negative controls. Positive immunochemical staining appears as cytoplasmic brown dots. Scale bar = 50 µM. (B) GSEA plot comparing DIPG gene expression profile with the signature described for sensitivity and resistance to dasatinib (upper panels) and summary of other significant gene sets (FDR ≤ 0.25) related to dasatinib targets (lower panel).