
Fig. 2.
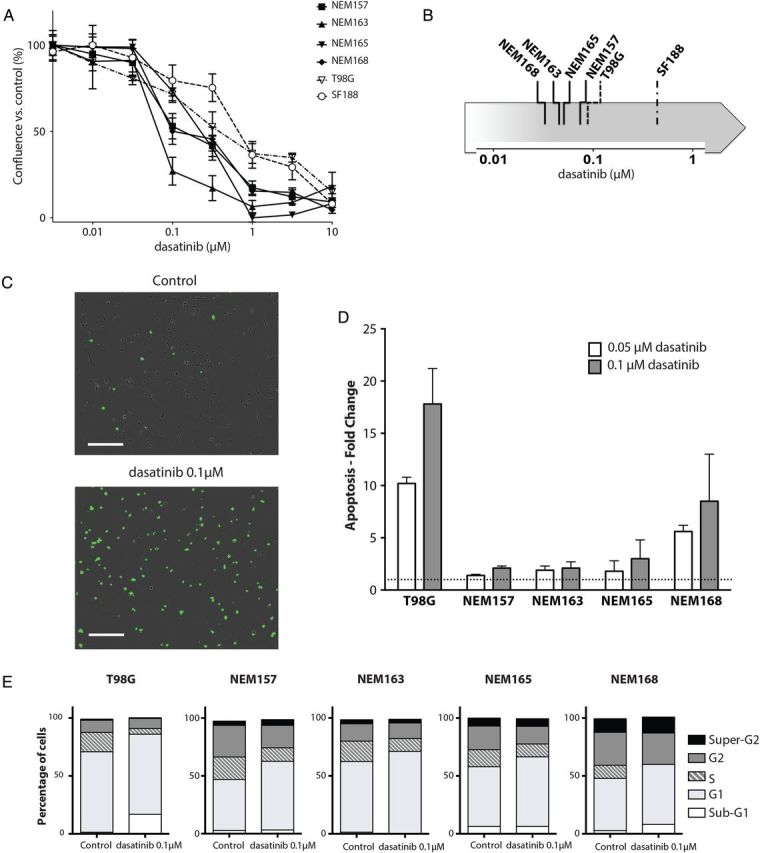
Effect of dasatinib on DIPG cell line in vitro. (A) DIPG cell lines (NEM), T98G, and SF188 were treated with the indicated doses of dasatinib or vehicle for 3 days and growth was measured using the confluence algorithm. Results are the mean percent inhibition compared with control cells ± SEM of 3 experiments carried out in triplicate. (B) Representative classification of dasatinib sensitivity by IC50 determination for each cell line. (C) Contrast phase fluorescent images of NEM168 12 h posttreatment. Nuclear staining indicates loss of membrane integrity. Scale bar = 300 µM. (D) Cells were plated in complete medium with or without the indicated dose of dasatinib or vehicle for 72 h, stained with annexin V and propidium iodide, and analyzed by flow cytometer, as described in Materials and Methods. Apoptosis detected in the control cells was set to 1 and is represented by the dashed line. Results are the mean ± SD of duplicate representatives of 3 experiments carried out. (E) Distribution of cells in sub-G1, G1, S, G2, and super-G2 phases was determined after propidium iodide staining and by using the Dean-Jet-Fox algorithm in FlowJo software.