
Fig. 3.
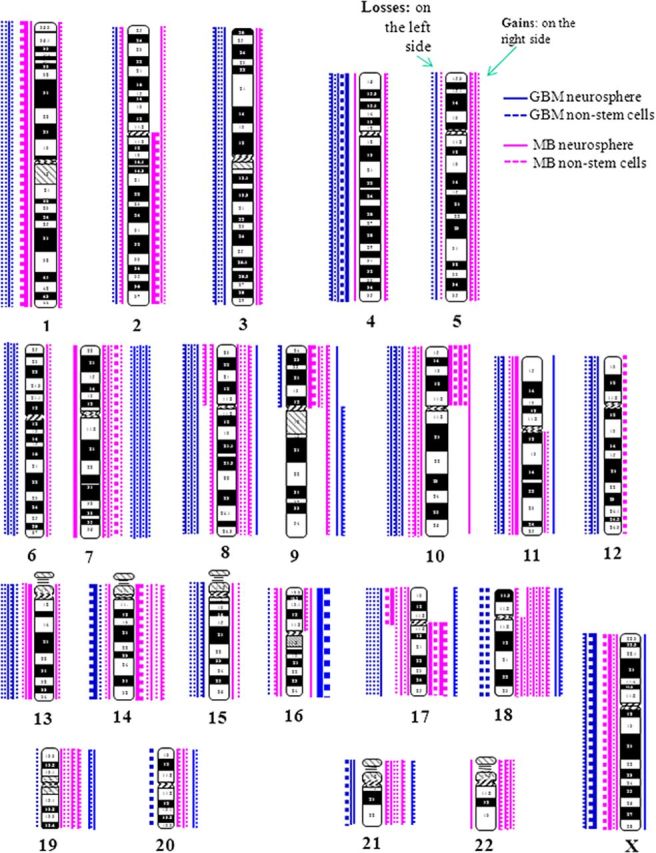
Ideogram showing chromosome aneuploidies or chromosomal arm gains/losses. Chromosomal losses were plotted at the left side and gains at the right side of each chromosome (blue for high-grade gliomas and pink for medulloblastomas). Neurospheres are represented by solid lines and monolayer cultured NSTCs by dotted lines.