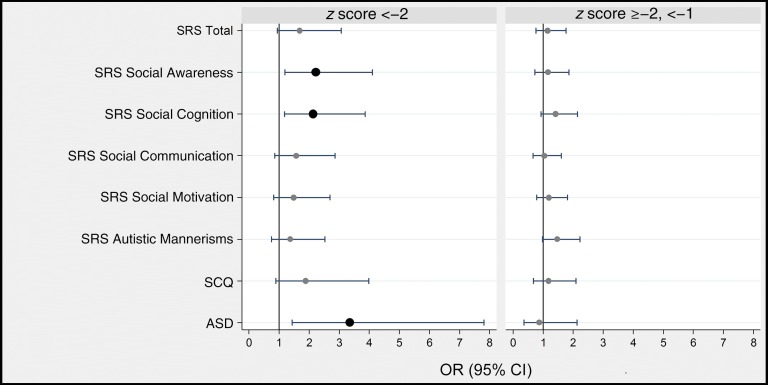
FIGURE 3.
Forest plots of ORs and 95% CIs of a T score ≥60 on the SRS subtests, of a positive screening result on the SCQ, and of documented characteristics of ASD on the basis of the ADOS-2 at age 10 years associated with birth weight z score category <−2 (on left) and ≥−2, <−1 (on right). ORs are adjusted for racial identity and sex. BW, birth weight.

