
FIG. 1.—
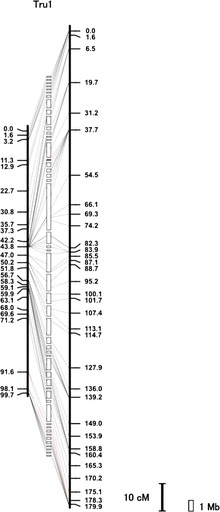
Fugu chromosome 1. Vertical black bars represent the male (left) or female (right) genetic map. Distances in centimorgans (cM) are indicated below (Kosambi mapping function). White boxes sandwiched between the male and female maps represent scaffolds. Scaffolds containing centromeric repeat sequences are labeled in red (see supplementary fig. S2 and Supplementary Data, Supplementary Material online). Transverse lines link the location of each marker on the genetic maps with its corresponding anchored scaffolds. Red transverse lines indicate disagreement between the position of marker on the genetic map and that of physical map. Such differences could be due to a misassembly in the reference sequence or an actual polymorphism between the mapping population and the sequenced individual. Gap between scaffolds is arbitrary because the actual distance between scaffolds is unknown. Scale bars represent 10 cM and 1 Mb. Details of all chromosomes and anchored scaffolds are shown in supplementary figure S2 and Supplementary Data, Supplementary Material online.