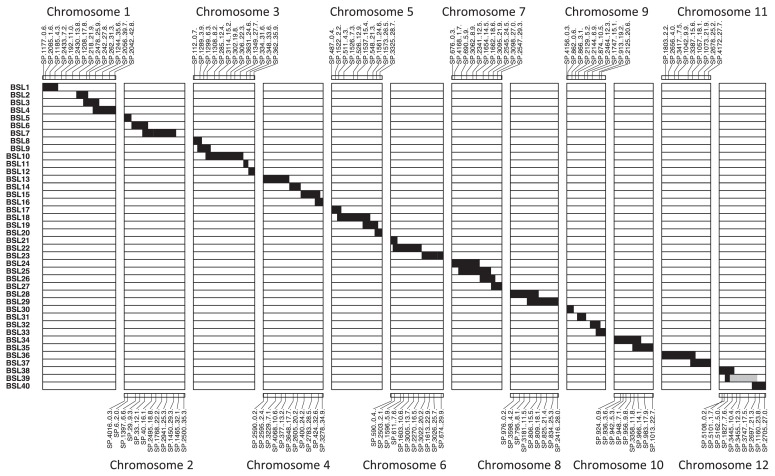
Fig. 2.
Graphical representation of the genotypes of the 40 BSLs. White bars and black bars indicate homozygous chromosomal segments derived from Koshihikari (O. sativa) and W0009 (O. barthii), respectively. Gray bars represent heterozygous regions. The SNP markers used for MAS are indicated with their physical positions (Mb) for each chromosome.

