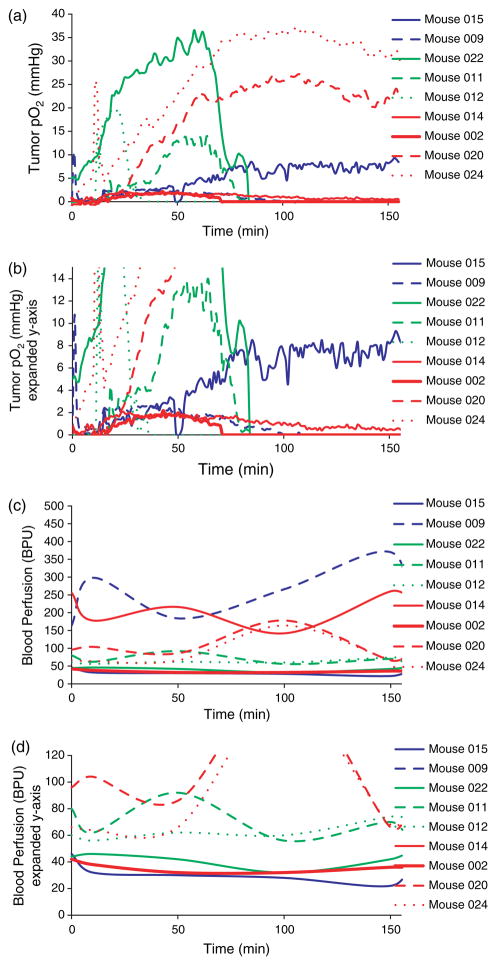
Figure 2.
Oxygen (a) and (b) and blood perfusion levels (c) and (d) in 9 HT766t tumor xenografts in mice. Figures (b) and (d) are expanded views of the y -axes from Figures (a) and (c), respectively. They are shown to better view the oxygen and perfusion changes in tumors with lower average values. The different traces (lines) in all graphs represent 9 tumors in 9 different mice. Each mouse was given a single dose of NVX-108: 0.3 mL/kg (blue traces), 0.45 mL/kg (green traces) or 0.6 mL/kg (red traces).

