
Fig. 4.
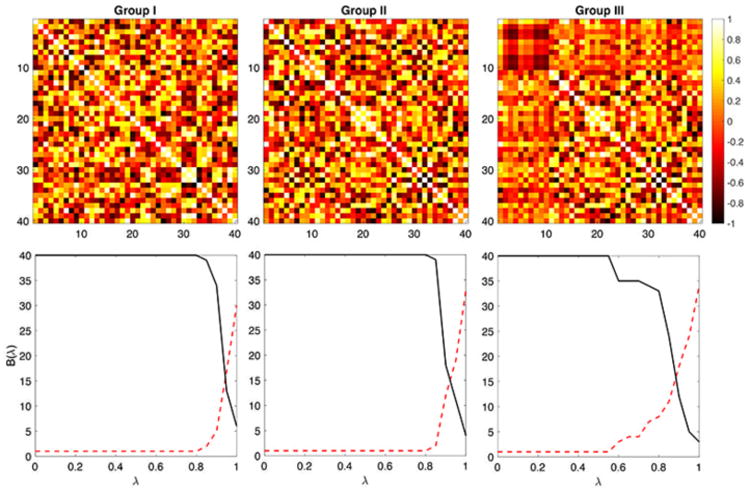
Simulation studies. Group I and Group II are generated independently and identically. The resulting B(λ) plots are similar. The dotted red line is β0 and the solid black line is the size of the largest connected component. No statistically significant differences can be found between Groups I and II. Group III is generated independently but identically as Group I but additional dependency is added for the first 10 nodes (square on the top left corner). The resulting B(λ) plots are statistically different between Groups I and II.