
Fig. 6.
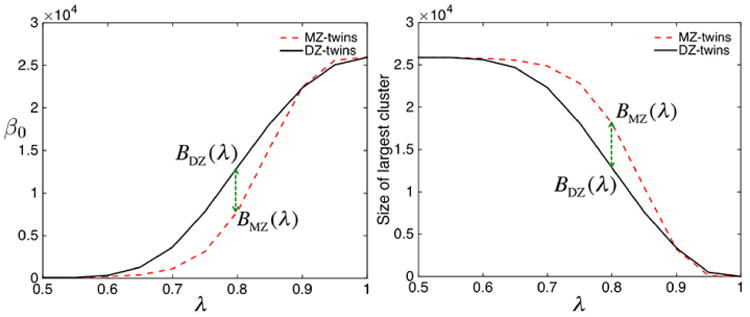
The result of graph filtrations on twin fMRI data. The number of connected components (left) and the size of the largest connected component (right) are plotted over the sparse parameter λ. For each λ, MZ-twins tend to have smaller number of connected components but larger connected component. The dotted green arrow (Dq) where the maximum group separation occurs.