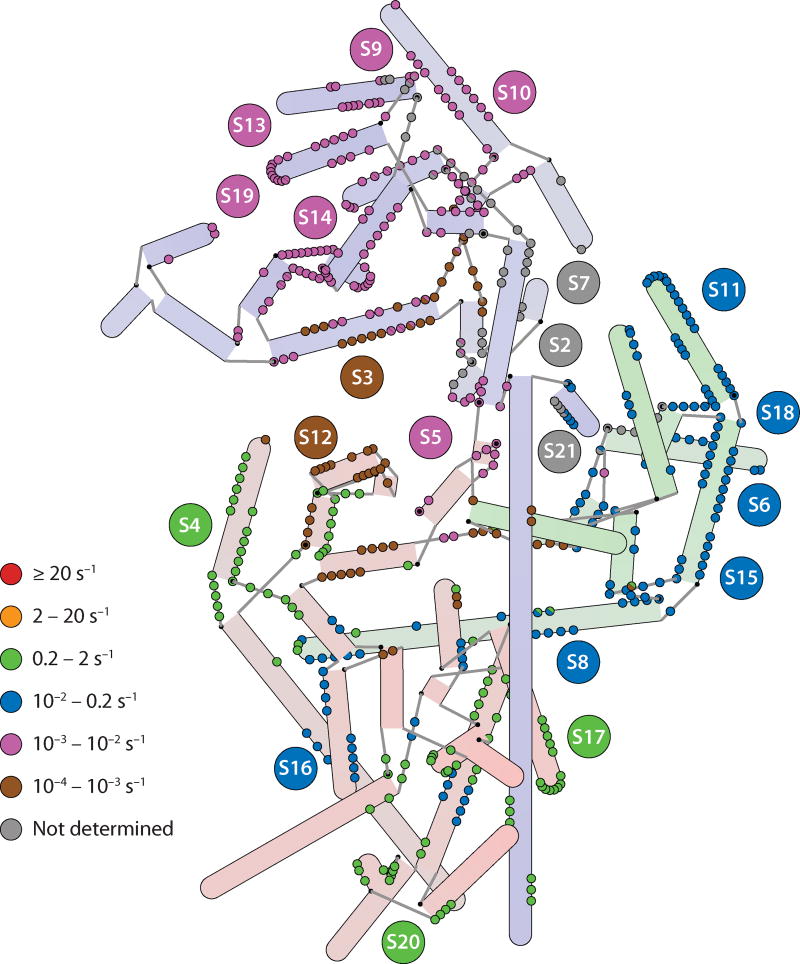
Figure 5.
A hybrid representation of the 16S rRNA annotated with rate constants for protein binding as determined by pulse-chase quantitative mass spectrometry (55). Nucleotides that make protein contacts are color-coded according to the binding rate of the protein that they contact. In the case in which two proteins are contacted by a single nucleotide, semicircles are drawn. Nucleotides that contact proteins S2, S7, and S21 are marked in gray, as no rate constant was obtained for these proteins. Rates generally cluster by domain, with the fastest binding rates observed in the 5′ domain and the slowest in the 3′ domain, the exception being the 5′ domain protein S12, which is among the slowest binders (indicated by the brown circles in the 5′ domain).

