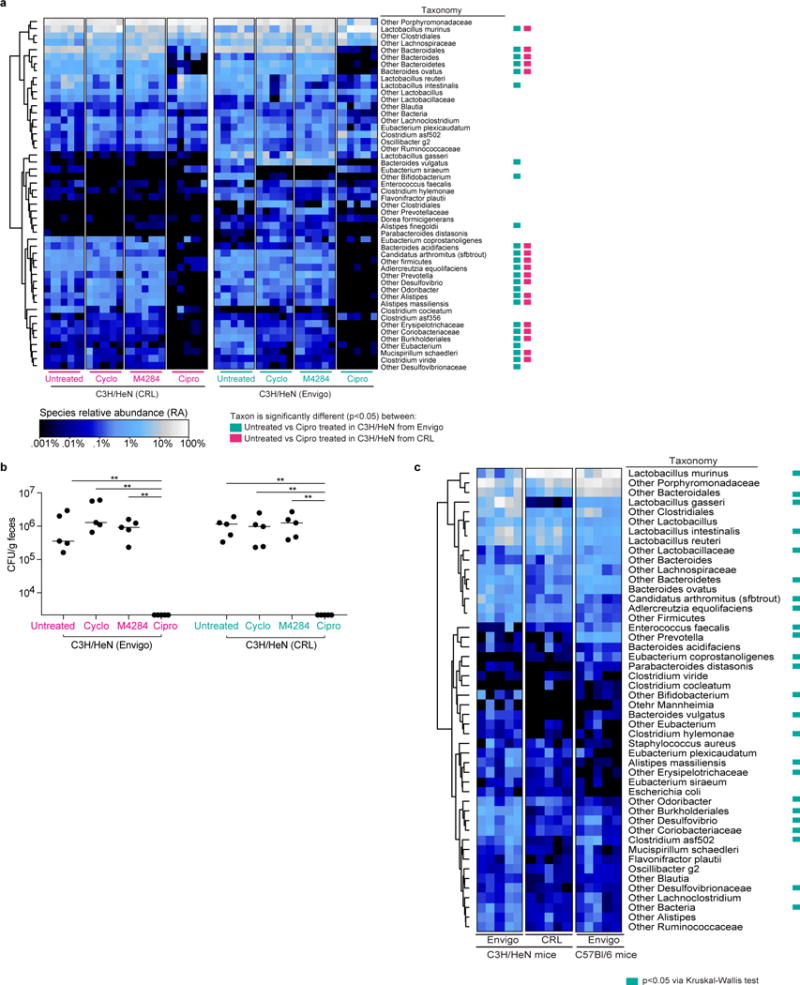
Extended Data Figure 8. 16S rRNA-based comparison of fecal bacterial communities in mice obtained from Envigo and Charles Rivers Labs and mice of different genetic backgrounds from a common vendor.

(a) C3H/HeN mice were treated with M4284 (100mg/kg, 3 doses over 24 h), vehicle alone (10% cyclodextrin (Cyclo), 3 doses over 24 h), or ciprofloxacin (Cipro; 15mg/kg, 2 doses over 24 h). Untreated mice served as reference controls. Heatmaps show the effect of each of the treatments on animals from CRL and Envigo. Each row represents a species-level bacterial taxon, while each column represents a mouse sampled 24 hours after the termination of the indicated treatment. Colored boxes next to the taxon names indicate species whose relative abundance was significantly changed by Cipro treatment (p<0.05;Wilcoxon Signed Rank test with FDR correction). Individual comparisons between untreated and other treatment types did not disclose changes that were statistically significant by Wilcoxon Signed Rank test with FDR correction. (b) Corresponding fecal samples collected 24 h after treatments (as shown in Extended Data Figure 8a) were homogenized, diluted serially, and plated on MacConkey medium. The abundance of bacteria capable of growing on the selective medium was similar between fecal samples taken from untreated mice and those collected 24 hours after treatment with cyclodextrin and M4284. No colonies were detected from fecal samples collected 24 hours after ciprofloxacin treatment. (c) Comparison of the representation of bacterial taxa in the fecal microbiota of untreated mice obtained from different vendors or representing different genetic backgrounds. Each row in the heatmap represents a species-level taxon, while each column represents a mouse of the indicated genetic background from the indicated vendor. Colored boxes indicate species whose relative abundances were significantly different (p<0.05) between all three groups of animals (Kruskal-Wallis test with FDR correction). Rows of each heatmap were hierarchically clustered according to pair-wise distances using Pearson correlation. n=5 mice per treatment type, 1 biological replicate (a). n=5 mice, 1 biological replicate (b). n= 5 mice per vendor/mouse strain, 1 biological replicate (c). bar = median; **p<0.001, Mann Whitney U test (b).
