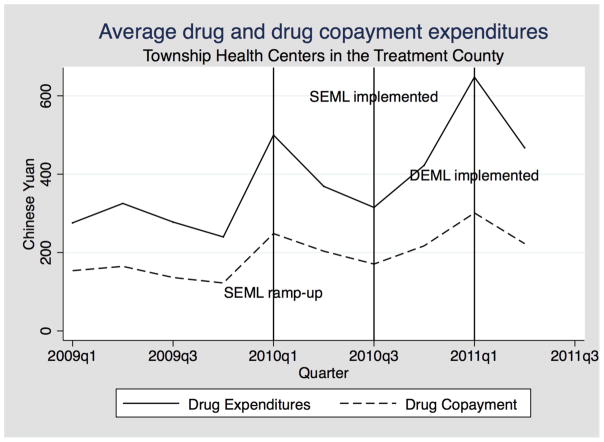
Figure 1. Spike in average drug expenditures per patient quarter before supply-side EML.
Note: The upper line represents average pharmaceutical expenditures per patient quarter; the lower line represents average out-of-pocket spending on pharmaceuticals per patient quarter. The first vertical line represents the SEML (“zero mark-up”) policy ramp-up period. The second represents the implementation of supply-side EML, SEML (“zero mark-up”), in June 2010. The third vertical line shows implementation of improved insurance coverage with demand-side EML (DEML).

