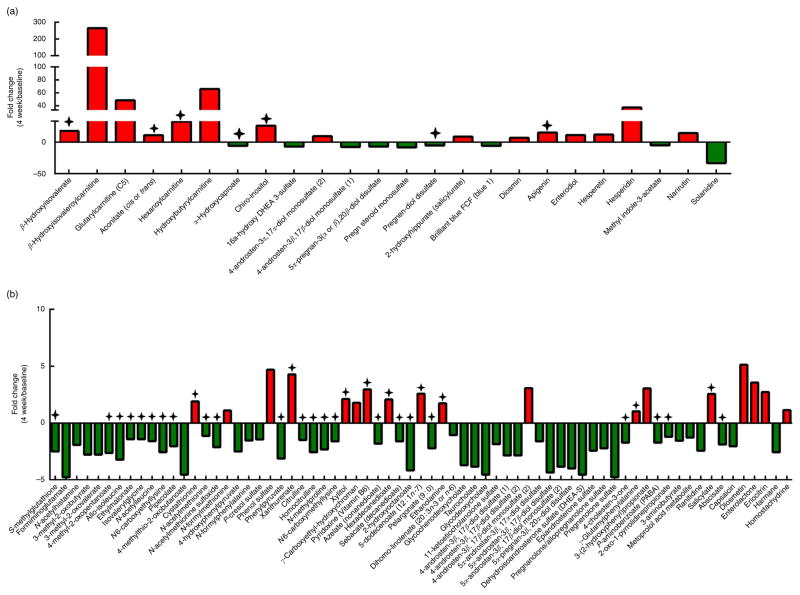
Fig. 1.
Stool metabolite profile differences in the rice bran group over time. (a) Stool metabolites that were significantly different between 4-week and baseline time points with fold change values ≥5·00 and (b) stool metabolites that were significantly different between 4-week and baseline time points and had fold change values <5·00., Metabolites with significance and were identified in the rice bran food metabolome (see online Supplementary Table S3).

