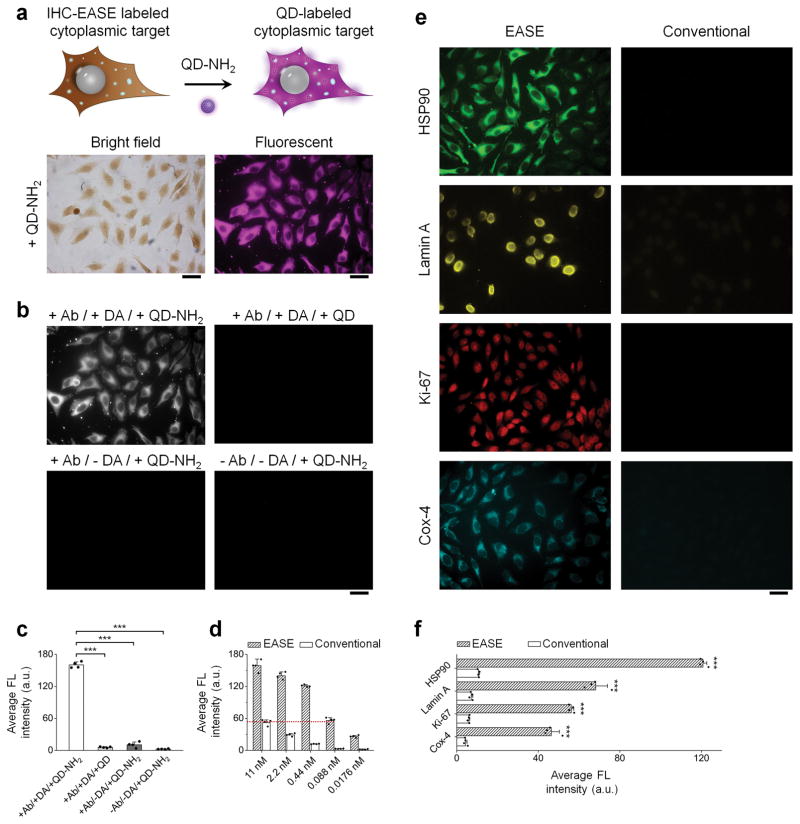
Figure 3. IF-EASE cell staining.
(a) IHC-EASE labeled cells further labeled with QD-PEG-NH2 (NH2-QDs). Fluorescence imaging of HSP90 shows consistent staining pattern after QD adsorption (compared with the bright-field images before QD labeling). Scale bar, 50 μm. (b & c) Verification of staining specificity by comparing the experiment group with various controls (antibody and/or dopamine is missing). Scale bar, 50 μm. The intensity differences between the experiment and controls are highly significant. ***P < 0.001 by two-tailed t-test. Error bars, s.d. over four different images. (d) Quantitative evaluation of IF staining intensity with or without EASE. Signal intensity obtained using IF-EASE at 88 pM 1’Ab is roughly the same as the intensity obtained with conventional IF at 11 nM 1’Ab. Error bar, s.d. over four different images. (e) Fluorescence imaging of four targets (HSP90, Lamin A, Ki-67, and Cox-4) stained with or without EASE at a 1’Ab dilution of 1:25,000. Scale bar, 50 μm. (f) Quantitative measurements of the cell fluorescence intensity showing in (e). The differences are statistically significant. ***P < 0.001 by two-tailed t-test. Error bars, s.d. over four different images.

