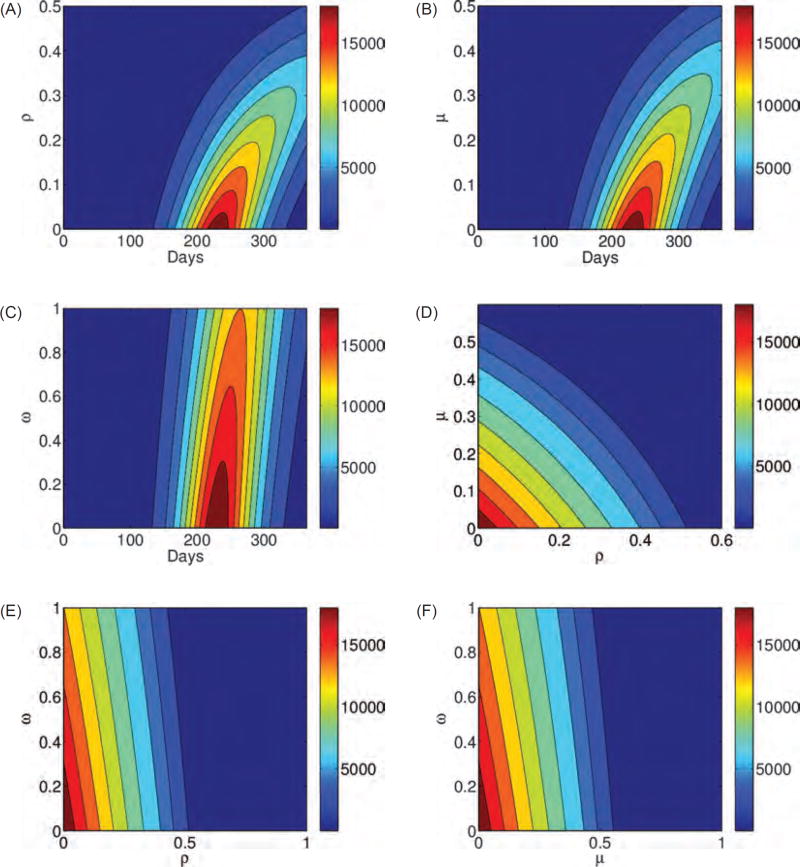
Fig. 4.
Contour plots A, B, and C of the three-stage model, given by Eq. (1), illustrate the total number of cases as a function of the fraction of the population that changed the behavior immediately after the infection, or during stages 1 or 2, (ρ, μ, and ω), respectively, and sustained these alteration in their daily routine. Contour plots D, E, and F show the peak of the total number of cases as a function of ρ and μ, ρ and ω, ω and μ, respectively. The higher the percentage of individuals following CDC recommendations and the earlier this preventive behavior is employed and sustained the lower and more delayed epidemic peak. Results are similar for the four-stage model.

