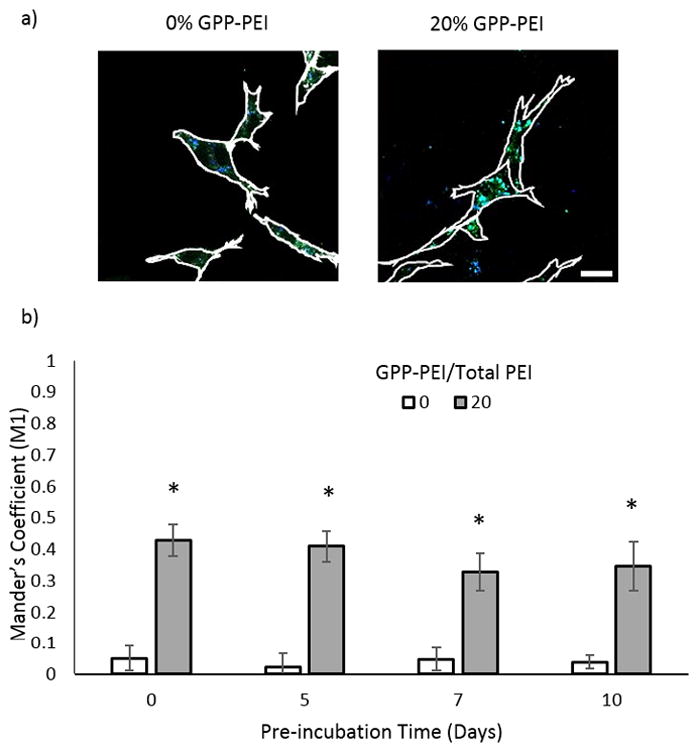
Figure 3.

Collagen-polyplex colocalization study. a) Representative fluorescent microcopy images of cells collected from gels preincubated for 5 days. The scale bar is 25 μm. b) Quantitative analysis of intracellular collagen-polyplex association by calculation of Mander’s coefficients for colocalization of FITC-collagen with Alexa Fluor 350-polyplexes in NIH/3T3 cells. The data for the 0, 5, and 7 day preincubations represent the mean +/−standard deviation of 10 separately analyzed cells. For the 10 day preincubation, 5 separately analyzed cells were analyzed.
