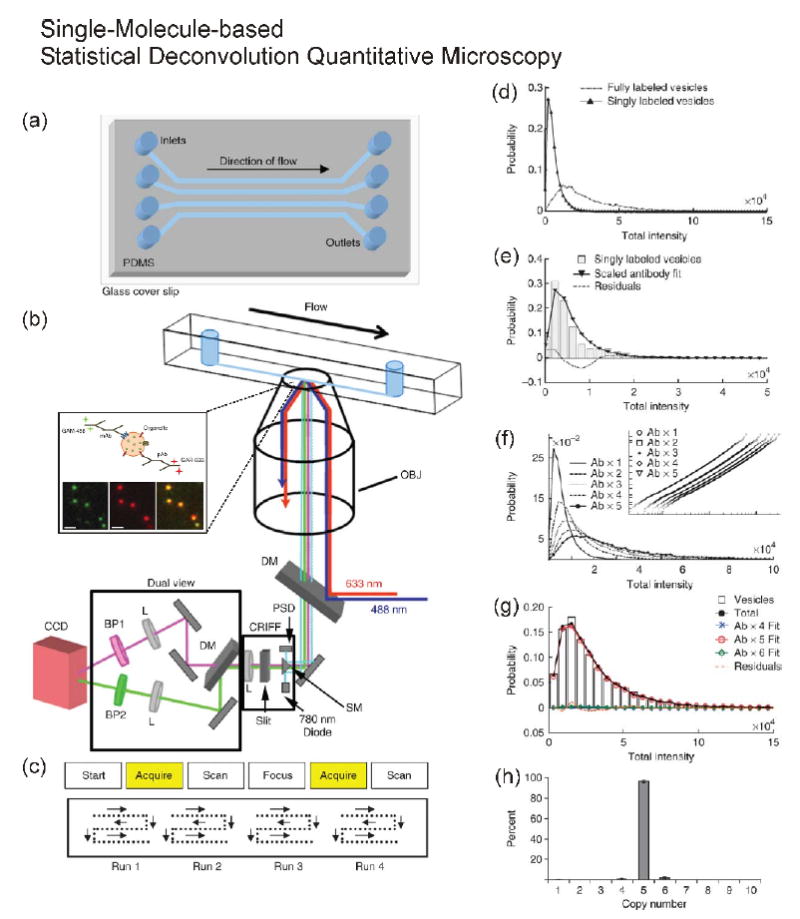
Figure 1.

Schematic diagram of single-molecule-based statistical deconvolution quantitative microscopy combined with a microfluidic chip and an example of statistical deconvolution. (a) Microfluidic chip, (b) Total-internal-reflection-fluorescence (TIRF) microscopy, and (c) automatic scanning patterns for collecting images. The expansion of inside of the microfluidic chip in (b) shows synaptic vesicles labeled with primary and dye-tagged secondary antibodies in the imaging plane using TIRF microscopy. (d-h) The detailed procedures of counting of a fully labeled sample using single-antibody distribution. (d) Comparison of synaptic vesicles singly or fully labeled with primary and secondary antibodies. (e) Fitting of single-labeled synaptic vesicles. (f) Plotting of multiplication of the scaled single-antibody distribution to generate calibration curves for fitting. (g) A plot showing the fit for the protein SV2 on synaptic vesicles. (h) Results of fitting six different SV2 data sets. Reprinted with permission from Nature Protocol [26].
