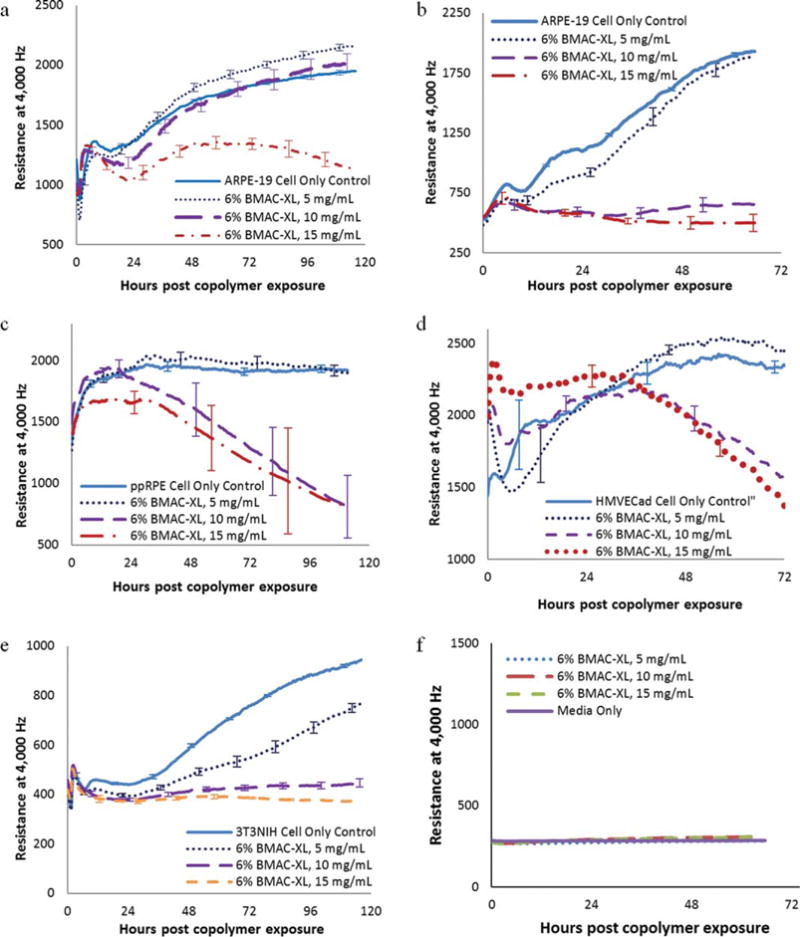
FIGURE 8.

Comparison of resistance measurements of (a) ARPE-19 cells plated at high density (20,000 cells/well), (b) ARPE-19 cells plated at low density (7,500 cells/well), (c) ppRPE cells (20,000 cells/well), (d) HMVEC cells (5,000 cells/well), (e) 3T3NIH cells (10,000 cells/well) exposed to copolymer containing 6 mol % of BMAC. Each data point represents the average of three or four wells, and error bars represent the standard error as established by the standard deviation divided by the square root of the well number.
