
Figure 8.
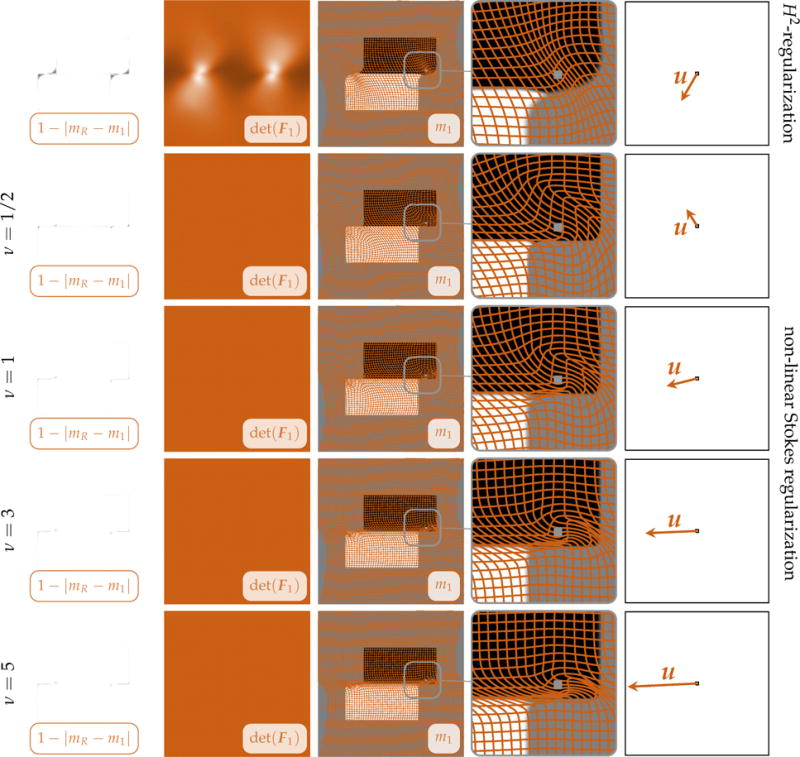
Exemplary registration results for the sliding rectangles (see Fig. 7). We study the effect of shear control (nonlinear Stokes regularization). We compare plain H2-regularization (top row; γ = 0; βv = 1E−2) to a linear Stokes regularization model (third row from the top; H1-regularization; γ = 1; βv = 1E−3) and a nonlinear Stokes regularization model (second row from the top: ν = 1/2 (shear thickening; βv = 1E−2); first and second row from the bottom: ν ∈ {3, 5} (shear thinning; βv = 1E−3)). We show (from left to right) (i) a map of the residual differences between the reference image mR and the deformed template m1, (ii) a map of the determinant of the deformation gradient, (iii) a deformed grid overlaid onto the deformed template image m1 (to illustrate the deformation map y), (iv) a close up of the latter for a particular area of interest, and (v) a single displacement vector at x = (4.66, 3.25) (the location is indicated as a gray rectangle in the visualization of the deformed grid; the size of the box is 25 × 25 grid points).