
Figure 2. Comparison of the T7 and pol II eGFP minigenome systems.
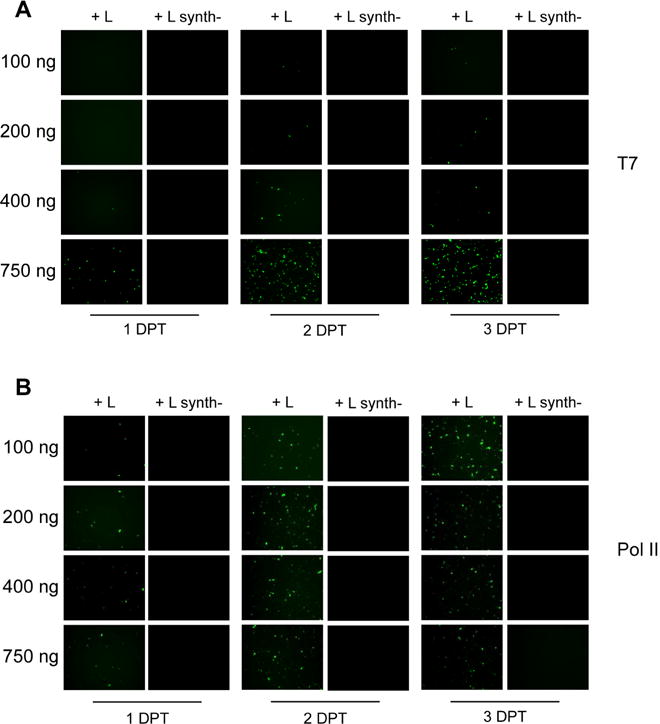
293T cells were transfected with the indicated concentrations of either the T7 (A) or pol II (B) driven minigenome system along with the necessary support plasmids. As a negative control, cells were co-transfected with a plasmid encoding inactive L (Lsynth−) in place of the plasmid encoding the functional L. Images are representative of eGFP expression (shown in green) monitored at one, two, and three days post transfection (DPT) from two independent experiments.