Figure 4.
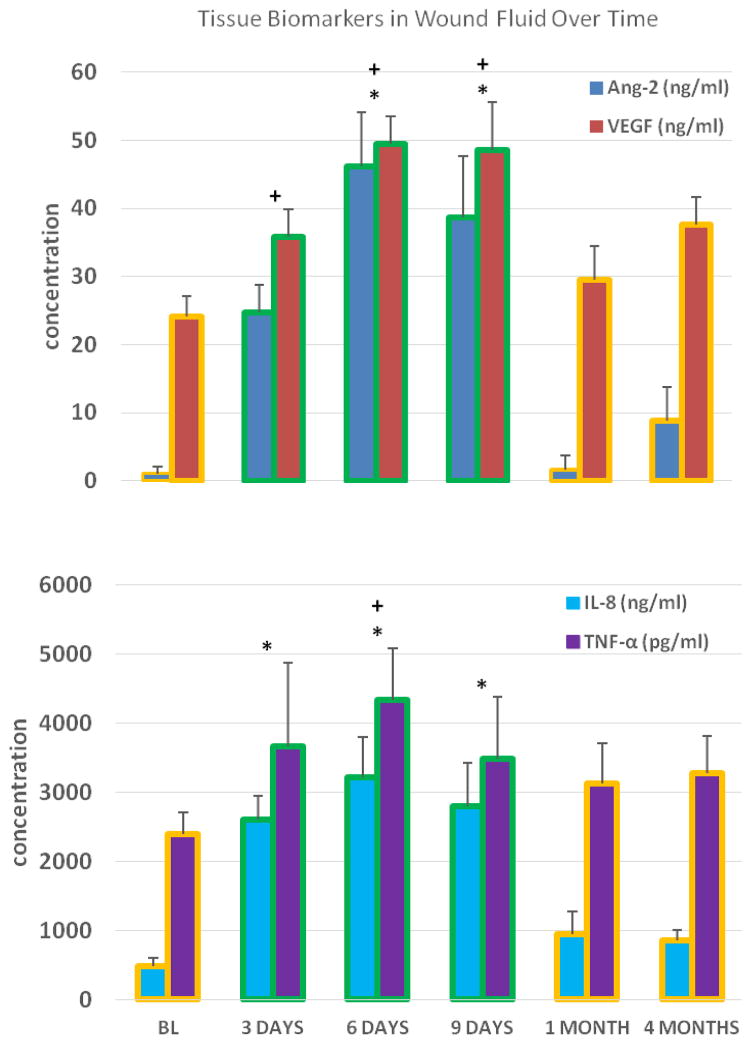
Figures 4A and 4B. Tissue Biomarkers in Wound Fluid Over Time
Crevicular fluid collected from adjacent teeth (BL; baseline, 1 and 4 months) and wound fluid from wound edge (days 3, 6 and 9); n= 15 for all data points. Bars with yellow outline represent crevicular fluid data and bars with green outline represent wound fluid data
* p≤0.01 (Ang-2 and IL-8 gene expression; difference from baseline)
+ p≤0.05 (VEGF and TNF-α gene expression; difference from baseline)

