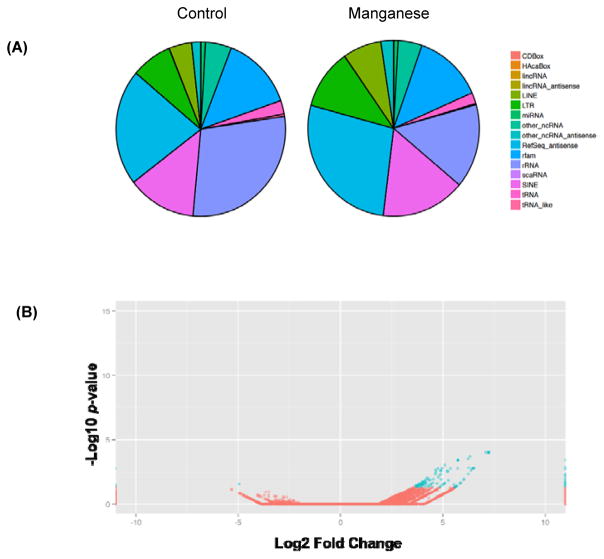
Figure 4. Manganese exposure leads to differential expression of small RNAs.
(A) Percentage of reads mapping to a variety of small RNA types. Comparison of RNA profiles between vehicle- (left) and Mn-stimulated (right) samples reveals different abundances of small RNA subtypes. (B) A volcano plot shows fold change and significance for every miRNA tested. Plotted points identify both the magnitude and significance of differential expression for all miRNA for vehicle- and Mn-stimulated samples. P-values are corrected for multiple comparisons with p ≤ 0.05 (blue dots) considered significant.

