Figure 5.
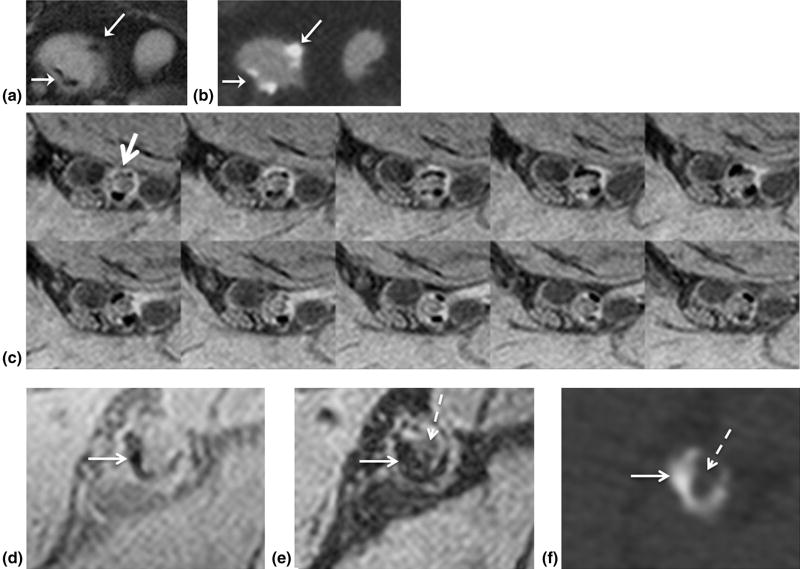
Detection of calcium. Visualization of calcium (arrows) in right common iliac artery aneurysm on (a) gray blood (GB) and (b) computed tomography angiography (CTA) images (same patient as in Fig 4). (c) Magnified view of 10 contiguous slices representing 1.5 cm of the right tibial-peroneal arterial segment (arrow) in a 66-year-old type-2 diabetic patient with ABI = 0.57. Spatially registered (d) GB and (e) black blood images corroborate calcium (white arrow) and obstruction (dashed arrow) in (e) detected by (f) CTA in left superficial femoral artery (SFA). Hypointense lumen signal (dashed arrow) surrounded by calcium (white arrow) in right superficial femoral arteries indicates obstruction.

