Figure 7.
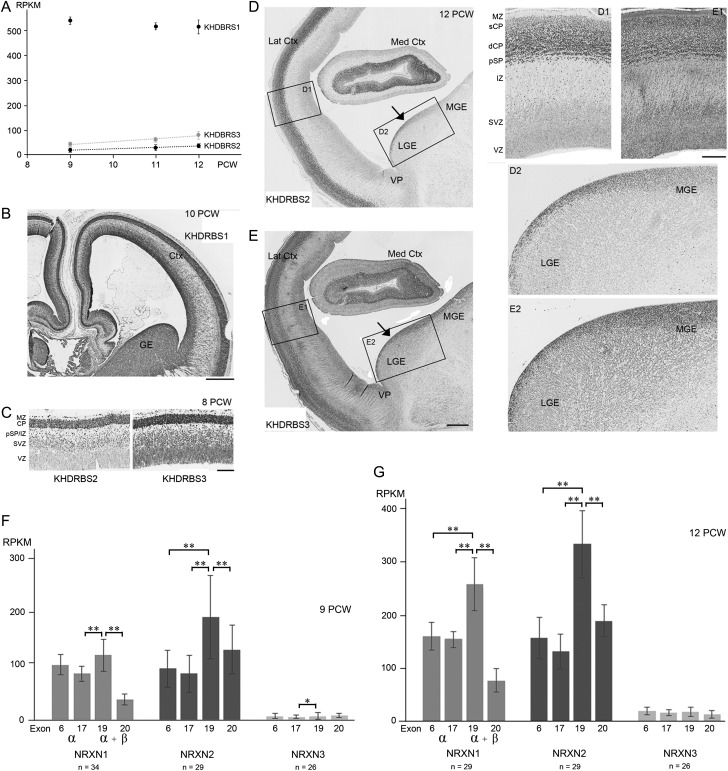
KHDRBS 1–3 expression in human early fetal forebrain and suppression of NRXN exon 20. (A) RNAseq analysis found very high expression of KHDBRS1 maintained with age, and moderate expression of KHDRBS2 and 3 which increased with age (dotted trend lines indicate a significant correlation, P < 0.001). (B) Patterns of KHDRBS immunoreactivity reflected mRNA expression; KHDBRS1 immunoreactivity was intense throughout the telencephalon at 10 PCW. (C) At 8 PCW, many KHDBRS2 positive cells were observed in the MZ, CP, and pSP, isolated cells were also seen in the IZ and SVZ; there was stronger immunostaining for KHDBRS3 in the CP, MZ, and pSP/IZ, with widespread moderate immunoreactivity in the SVZ and VZ. At 12 PCW, KHDBRS2 immunoreactive cells were predominant in the deeper part of the CP (dCP), pSP and MZ, but rare in the superficial CP (sCP). Scattered positive cells were observed in the IZ and SVZ along with a small number in the VZ (D and D1). For KHDBRS3, a complex pattern of immunostaining was observed in the cortex with more immunopositive cells in the sCP and close to the boundary with the pSP, but with a band of weaker immunoreactivity in the middle of the CP. Weak to moderately immunoreactive cells were present throughout the IZ and proliferative layers (E and E1). KHDBRS2 expression was greater in the proliferative zone of the LGE than the MGE with a few scattered positive cells present in the postmitotic mantle zone (D and D2). KHDBRS3 immunopositive cells were present throughout the proliferative zones of the LGE and MGE, with scattered cells observed in the postmitotic mantle zone (E and E2). Med and Lat Crtx, medial and lateral cortex; VP, ventral pallium, border between cortex and ganglionic eminences. (F and G) Expression of four exons, present in all three NRXNs, were chosen for analysis; 6 and 17 that are in the alpha (α) isoforms only of NRXN proteins, and 19 and 20 translated in both alpha and beta (β) isoforms. KHDBRS proteins splice NRXN mRNA to exclude exon 20. Statistically significant reductions in exons 6 or 17 compared to 19 indicate less expression of α compared to the β isoforms, and significant reductions in 20 compared to 19 indicates suppression of exon 20 expression by KHDBRS proteins (*P < 0.05, **P < 0.01 by Tukey's post hoc test). Error bars indicate standard errors of the mean. Scale bars = 750 µm for B; 200 µm for C; 1 mm for D and E; 250 µm for D1, D2, E1, and E2.

