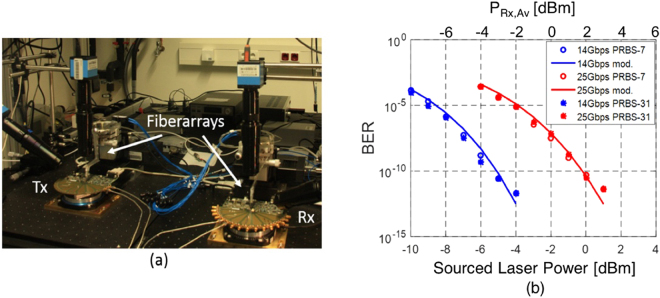
Figure 13.
(a) Photograph of the test setup combining the Tx and Rx evaluation boards and (b) measured BER (points) as a function of sourced laser power (lower x-axis) and average power at the receiver (upper x-axis, after 24 dB amplification by the SOA), as well as predicted BER based on the link model (continuous lines). The BER is given as a function of the sourced laser power, as it is the objective of this work to assess the compatibility of the link architecture with the capabilities of semiconductor MLLs. Given the sensitivity floor of the SiP Rx (−13 dBm at 14 Gbps, −9.7 dBm at 25 Gbps), the noise budget is completely dominated by ASE and RIN, and a substantial signal attenuation could be tolerated after the SOA prior to receiver noise playing a substantial role.

