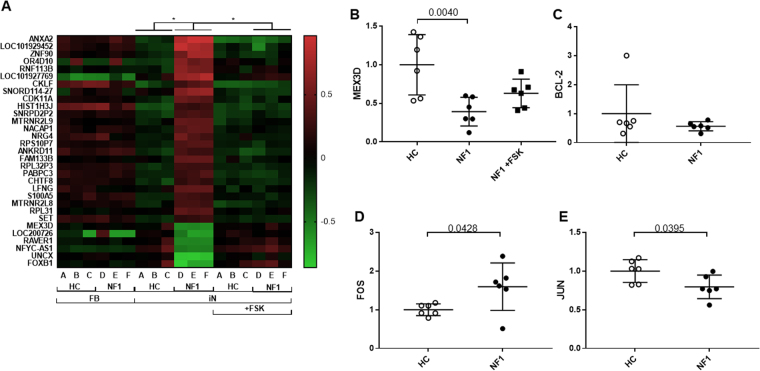
Figure 2.
Unique gene expression profile in iN cells from patients with NF1. (A) Heatmap of the 31 genes that were revealed as aberrant in microarray analysis. *limma adjusted p-value < 0.05. Red indicates higher expression genes, and green indicates lower expression genes. (B) MEX3D mRNA expression level. One-way ANOVA/Tukey’s test, n = 6 each group. (C–E) BCL2, FOS, and JUN mRNA expression level, respectively. Student’s t-test, n = 6 each group. Open circles show healthy controls and filled circles and squares show NF1 patients.

