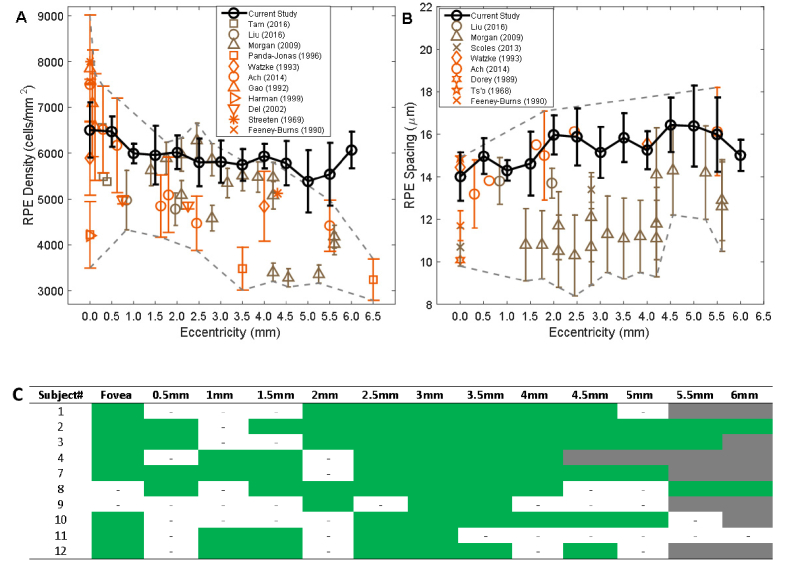
Fig. 4.
Comparison of AO-IRAF-based measurements of RPE cell density and cell-to-cell spacing (black) with previously-published data from in vivo (umber color) and ex vivo (persimmon color) studies. Symbols denote the mean value averaged over all subjects from each study, and error bars show standard deviation. For comparison, published data with a mean age less than 50 years were selected wherever possible, with the exceptions of Feeney-Burns (mean age 58.9 ± 7.4 years) and Panda-Jonas (58.6 ± 18 years). The region showing the range (within 1 SD) of all published data combined is delineated by the gray dashed lines. (A) RPE density measurements. (B) RPE cell-to-cell spacing measurements. Note that only direct measurements of spacing are included, and in particular no spacing values are inferred from density based on the assumption of a perfectly triangularly-packed mosaic, due to the previously-reported decrease in regularity at the peripheral locations [14]. (C) The subset of regions with a contiguous array of RPE cells that could be identified for this analysis is shown in green; areas that were imaged but not analyzable are labeled with small dashed lines. Retinal locations that were not imaged are shown in gray.

