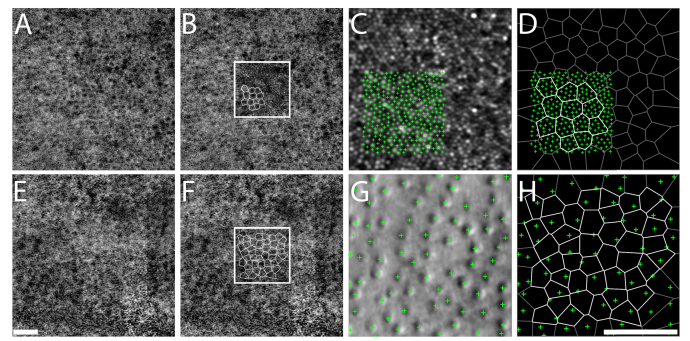
Fig. 5.
Relationship between RPE cells visualized using AO-IRAF (A,B,E,F) and overlying cone photoreceptors visualized using confocal reflectance (C) in the fovea and split detection at eccentric locations (G), illustrated in subject 3. Panels (B) and (F) depict ROIs selected for analysis from (A) and (E), with Voronoi boundaries calculated from the estimated cell centers overlaid (white lines indicate the actual Voronoi regions that were used for analysis; black lines, not used). The size of the ROI was further reduced in the fovea (C). Cone identifications were plotted relative to RPE cell voronoi neighborhoods (D,H) to quantify the average number of cone photoreceptors per RPE cell. Scale bar, 50 µm.

