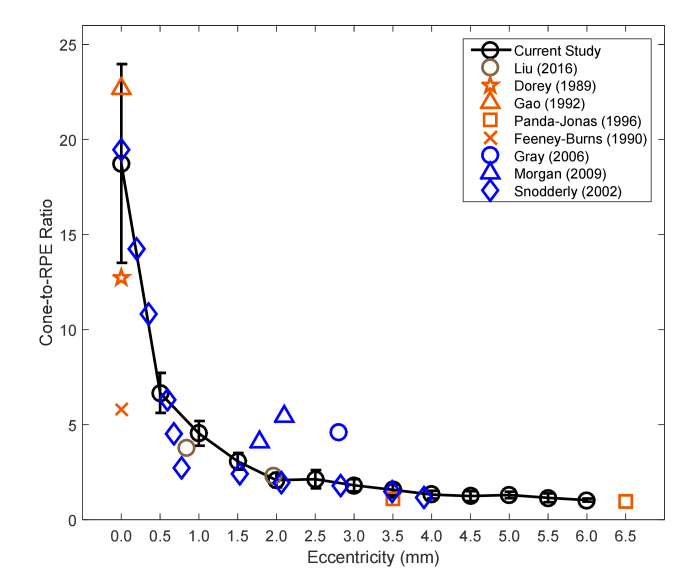
Fig. 6.
Relationship between RPE cells and photoreceptor cells along temporal eccentricity from the fovea with previously published data from in vivo (umber color) and ex vivo (persimmon color) human studies as well as from animal studies (blue color). Symbols denote the mean value averaged over all subjects from each study. Error bars represent the standard deviation.

