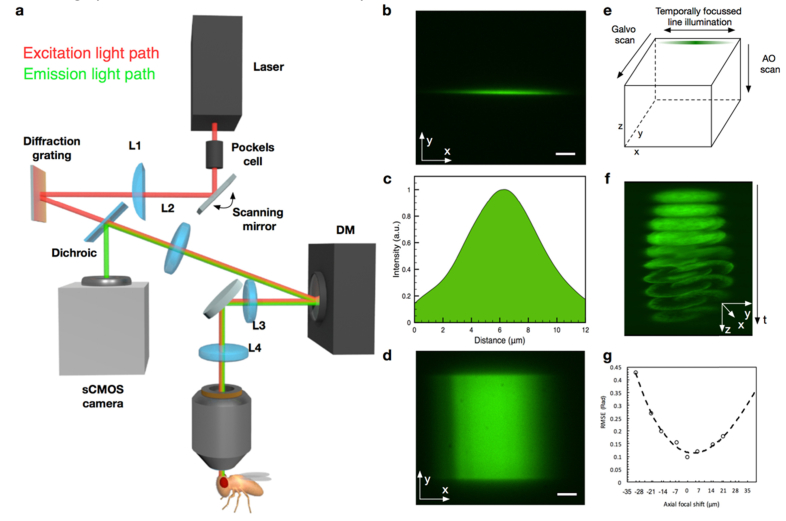
Fig. 1.
(a) Simplified schematic diagram of the AO-VAST microscope configured for in vivo imaging. (b) Illumination line exciting two-photon fluorescence in a fluorescent polymer slide indicating the shape of line illumination profile. (c) Axial profile of the excitation PSF obtained by recording fluorescence intensity when a thin layer of fluorescent dye is scanned through object plane (d) A single imaging plane obtained by laterally scanning an excitation line across a fluorescent plastic slide. (e) Volumetric imaging strategy: each optical slice is formed by scanning a line along the image plane; scanning along the optical axis is enabled by a deformable mirror. (f) Expanded 3D image of a pollen grain: the whole volume consisting of ten z-slices, each of thickness ~5 μm, was captured in 10 ms. (g) Wavefront root mean square error (RMSE) in radians for optical wavefront when remotely focusing to different axial positions. Data points are fitted with a 2nd order polynomial. In (b) and (d) the scale bar corresponds to 10 micrometers.

