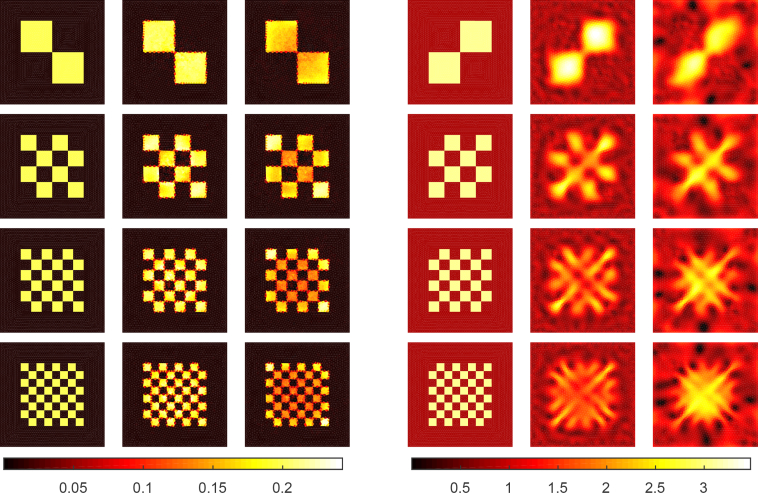
Fig. 3.
Absorption (columns 1–3) and scattering (columns 4–6) parameters with different distributions of the optical parameters (rows 1–4). Columns from left to right: simulated absorption (first column), reconstructed absorption obtained using the augmented (second column) and conventional (third column) QPAT, simulated scattering (fourth column), reconstructed scattering obtained using the augmented (fifth column) and conventional (sixth column) QPAT.

